You might spend two weeks of your life sitting in traffic. That’s not a feeling. It’s a statistic from the Texas Transportation Institute at Texas A&M University. The math is simple. If you drive every day, your dashboard clock is ticking down a chunk of your existence.
The 2007 study didn’t sugarcoat it. In 28 urban areas, drivers burned an entire work year sitting still. Boston. Detroit. Atlanta. San Francisco. Orlando. Minneapolis-St. Paul. All of them. Los Angeles? That’s the benchmark for the worst. Nearly two weeks gone. Just sitting there. Idling.
This isn’t just annoying. It’s expensive. The estimated cost for 2005 was over $78 billion. That number covers fuel and wasted time. It ignores the air quality damage. It ignores the health costs from pollution. Americans bought 2.9 billion extra gallons of gas because of congestion. The average driver paid $710 a year for the privilege of going nowhere fast.
Why does it happen? The basic explanation is brute force. Too many cars. Not enough road. The road’s capacity is exceeded. Simple. But the reasons why so many cars are in one place at one time are messy. Civil engineers spend hundreds of hours and millions of dollars trying to untangle the knot. City planners. Politicians. Homeowner associations. Everyone has a say. And everyone has a price tag attached to the solution. Who pays? That’s the hard question.
We are looking at the mechanics of gridlock. How highways choke. How surface streets jam. And what you can do to keep moving.
The Physics of a Traffic Wave
You’re on a five-lane highway. It’s packed. It feels like every car in the city merged at once. You creep forward. You stop. You wait. You start again.
Assume there’s no accident. No stalled vehicle. No construction crew blocking the lane. What’s left?
More cars entering the highway than leaving it.
That imbalance creates a traffic wave.
It starts with one driver braking. They have to. To avoid a collision. The car behind them brakes. Then the next car. The slowing trend travels backward. A domino effect. As long as cars keep approaching from behind, the congestion moves in a wave. It travels upstream. Backward. Until the traffic lightens enough for the wave to dissipate.
You can accelerate when space opens up. The person behind you waits a moment. Then accelerates. The person behind them waits longer. The congestion shifts slowly down the highway. It doesn’t clear instantly. It lingers.
Network Overload vs. Disturbances
Contributors to congestion fall into two buckets. Network overload. And traffic disturbances.
Network Overload
If a highway or surface street has heavy traffic regardless of conditions, it’s network overload. Demand always outweighs capacity. These are bottlenecks. Permanent snarls. The road is too small for the volume.
Traffic Disturbances
These are unpredictable. Accidents. Breakdowns. Construction. Harsh weather. You can’t predict where they hit, but they impact flow heavily.
Drivers slow down for rubbernecking. They change lanes. Road work shuts down lanes, forcing cars into open but crowded spaces. Bad weather makes people drive slower. Safety first.
The 2007 Urban Mobility Report from the Texas Transportation Institute says traffic incidents account for 52 to 58 percent of delays. More than half. Just incidents.
The Highway Problem
A 1999 study by the Texas Transportation Institute found over 31 percent of U.S. highways suffer serious congestion. That number has likely grown.
Travel on highways increased 131 percent over a 25-year period. The Department of Transportation expected another 40 percent increase by 2015. Highways make up just 1.2 percent of the length of all U.S. roads. But they carry nearly half of all truck traffic. Almost a quarter of all passenger traffic.
The system is strained. The infrastructure is old. The volume is high. And the waves keep coming.
Los Angeles isn’t alone. Major metros have sunk millions into sophisticated traffic communications. These systems alert drivers to changing conditions instantly. Road crews can race to trouble spots before gridlock sets in.
Cities have a few tricks up their sleeves for highway congestion.
Ramp Metering
Ramp metering forces cars to enter the highway at timed intervals. A traffic-light-style signal sits at the end of the on-ramp. The data is stark. Cities using this method report a reduction of 29.4 million hours in travel delay annually. Accidents drop significantly. Highway capacity actually goes up.
Minnesota’s DOT tested this heavily. They installed 430 ramp meters. Then they turned them off for seven weeks in 2000. The result? Accidents jumped 26 percent. When they turned the meters back on, highway capacity increased by 14 percent.
Ramp metering boosts speeds and cuts crashes. But it’s not quick. It takes a long time to implement. Engineers must investigate thoroughly. They need to ensure surface street traffic doesn’t collapse as cars back up to wait for the green light.
High-Occupancy Vehicle Lanes
HOV lanes are everywhere. They are reserved for cars with two or three passengers. The goal? Incentivize carpooling to reduce the total number of vehicles.
Some HOV lanes have exclusive off-ramps. This cuts out the need to merge with chaotic traffic. It saves time. It rewards shared rides.
Adding Lanes
Widening the road is a common reaction to congestion. Planners convert shoulders into lanes. They shrink existing lane widths. It’s expensive. It’s time-consuming. It’s controversial.
Studies are split. Some suggest widening only increases car volume without fixing the jam. Others argue it greatly reduces congestion.
Texas A&M Transportation Institute (TTI) research offers a hard truth. Adding lanes and widening roads only works if capacity stays ahead of population growth. If population outpaces the new asphalt, you’re just digging a deeper hole.
The debate over highway expansion has been raging for more than a decade. On one side, critics cite latent demand. This theory argues that as a highway expands and speeds up, other drivers who previously avoided the hassle will join. Soon, enough new drivers fill the void. The beneficial effect of expansion vanishes.
On the other side, proponents argue that faster commutes simply help motorists get where they need to go.
Which side wins when the road is full?

Highway congestion gets all the press. But look down. Look at the side streets. Suburban sprawl has turned quiet residential arteries into bottleneck nightmares. Civil engineers aren’t just pouring concrete anymore; they’re playing 4D chess with limited space. A bad intersection design doesn’t just annoy you. It creates safety hazards. It strangles surrounding streets. It kills flow.
Engineers have to balance a dozen conflicting variables. Your line of sight. The volume of expected traffic. The geometry of the corner. One mistake, and you’ve got a daily pile-up waiting to happen.
The Sprawl Problem and Fixed Infrastructure
Suburbs used to be sleepy. Now? They’re exploding. When neighborhoods grow overnight, the existing road network doesn’t just stretch—it snaps. Most cities are stuck with legacy systems. You can’t just dig up a main avenue to add a lane. It’s too expensive. It’s politically toxic. It’s often physically impossible.
So what’s left? Traffic lights.
Timed vs. Sensor-Controlled Signals
Most cities run on a hybrid model. Some lights are on a timer. Green for 40 seconds. Red for 40. Rain or shine. Midnight or rush hour. The schedule might shift slightly between AM and PM peaks, but it’s static. Predictable. Often inefficient.
Others use sensors. Inductive loops in the asphalt or cameras overhead detect a car. The light changes. This feels dynamic. It should be better. But advanced systems go further. They network signals to a master computer. The goal? Coordinated timing. You hit green wave after green wave.
“Even a well-designed traffic coordination system will only reduce traffic delay by approximately 1 percent.”
One percent. Think about that. You’re sitting in a lot for an hour to save 3.6 minutes? That’s the reality of incremental efficiency gains.
Channelizing Flow: Turn Prohibitions and Restricted Zones
If signals can’t fix it, geometry can. Traffic experts use turn prohibitions to force drivers into specific patterns. No left turn here. No right turn there. You’re channeled onto a wider arterial road instead of clogging up a neighborhood street. It’s not elegant. It’s punitive. But it moves metal.
Then there are auto-restricted zones. Areas where cars simply aren’t allowed. Boston’s Downtown Crossing Project is a prime example. It covers 12 city blocks. Pedestrians walk freely. Cars? Go around. It preserves historic districts. It reduces local exhaust. But it also shifts the congestion elsewhere.
The Congestion Pricing Debate
Some experts think we’re overcomplicating this. Alistair Darling, former British Secretary of State for Trade and Industry, argues for congestion pricing. The logic is simple. Drivers impose costs on the road. Wear and tear. Pollution. Noise. They should pay for it.
It’s like a toll road, but for the entire city center.
Imagine an electronic system tracking every vehicle. Each car has a unique RFID-style identifier. Sensors track your movement. Rates fluctuate. Peak hours? Highest price. Off-peak? Cheaper. Drive during rush hour in the zone, and you get fined. Or charged. Depending on how you spin it.
No such system exists yet. Not really. Not at scale. So there are no fixed rates. No established collection methods. It’s all theoretical.
Critics call it a political impossibility. Drivers are used to free roads. Take that away, and you’ll have riots. Look at Seoul, South Korea. They tried a similar idea. Massive public backlash. Accusations of hidden taxes. The backlash was so fierce it killed the momentum.
What Can You Do?
The infrastructure is broken. The pricing is political minefields. So what’s left for the average driver?
Traffic-jam Prevention
Stop contributing to the gridlock by fixing your own machine first. A well-tuned vehicle doesn’t break down. It doesn’t force you to pull over in a dangerous lane. It doesn’t add another stalled car to the mess. Regular oil changes and tune-ups matter. But the biggest win comes from your tires. Keep them at the right pressure. You’ll save money. You’ll save time. And your gas mileage could jump by up to 3.3 percent. It’s safer too. A sudden blowout on the highway isn’t just an inconvenience. It’s a hazard that creates a ripple effect of braking behind you.
When you’re moving, don’t speed up and then slam on the brakes. That’s how congestion waves start. The driver behind you reacts. Then the person behind them. Before you know it, you’re stuck in a wave of road rage and stopped metal.
The Logic of Virtual Slots
Ricardo Morla’s research on congestion-free road traffic offers a different perspective. He suggests imagining cars in virtual slots. Each slot takes up physical space and moves at a steady speed. The goal is simple: don’t overlap. Adjust your speed so you don’t collide with the slot ahead of you.
“By keeping a safe distance between you and other vehicles, you can help minimize congestion.”
It’s not a perfect system. If too many cars enter the highway, the slots fill up. The model breaks. But for everyone else, maintaining distance keeps the flow moving. It’s basic physics. Less braking means less wasted energy and less frustration.
The Problem with Congestion Pricing
Some people want to solve traffic by charging fees during peak hours. The theory is sound. If it costs more to drive at 8 AM, you might leave at 10 AM. The result? Fewer cars on the road during the worst rush.
But it’s not that simple. Critics call this regressive taxation. Why? Because only certain people can afford to change their schedule. White-collar professionals often have flexible hours. They can shift their meetings. They can work from home. They can pay the fee and glide past the gridlock.
Who can’t? People with set hours. The service workers. The lower-paying jobs. They don’t get to choose. They show up when they’re told. And if there’s a fee, they pay it anyway. The people least able to afford it end up footing the bill. It’s a system that punishes the poor for doing exactly what they’re supposed to do: go to work.
Carpooling and Public Transit
Carpooling works if you live and work near each other. Most cities have HOV lanes to reward that cooperation. Less pollution. Less stress on the environment. But you lose freedom. You have to align your schedule with someone else. You have to put off errands until you’re home. You have to trust that person will be on time.
Public transportation is another option. If your city has a good system, use it. It reduces the number of cars. It cuts down on emissions. But again, you’re giving up flexibility. You’re tied to a schedule. You’re subject to delays. It’s a trade-off. You gain efficiency. You lose autonomy.
The Hidden Health Toll
Even though modern cars emit less pollution than older models, traffic pollution is still rising. In an average city, 60 to 70 percent of the particles you breathe come from car exhaust. That’s not a small number.
A study in Europe linked over 40,000 deaths a year to traffic pollution. Asthma. Bronchitis. Heart conditions. The chemicals in exhaust are carcinogenic. They don’t just make the air smell bad. They damage your lungs. They strain your heart.
In the United States, Los Angeles, California holds the title for the worst air pollution according to the American Lung Association. It’s not just about traffic jams. It’s about who gets sick. It’s about who breathes easier. The next section looks at which cities are struggling the most with traffic, but the health cost is everywhere.

Why Los Angeles Still Holds the Crown for Worst Traffic
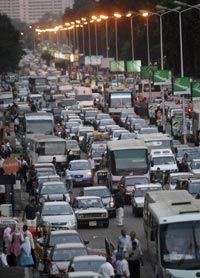
You know the drill. Los Angeles sits at the top of the Texas Transportation Institute’s (TTI) annual misery list. It’s the punchline of every sitcom, movie, and song that involves a commute. Forget that fictionalized “24” timeline where you can traverse the metro area in fifteen minutes. In reality, the Los Angeles traffic ranking is a harsh reminder of gridlock.
The travel time index hits 1.92. Do the math. Peak hour trips take nearly double the time of off-peak runs. If you’re planning a drive during rush hour, double your ETA.
The Commuter Reality in the 605
The 2000 Census data paints a stark picture of how we move. About 81% of workers in LA rely on personal vehicles—cars, trucks, vans. Of that huge cohort, 66% drive alone. Carpools? They represent a mere 14.7% of the flow. With nearly 1.5 million workers in the system, most of them are on the road during peak windows.
The cost isn’t just fuel. The average motorist loses 72 hours a year to traffic jams. That’s two full workweeks staring at the bumper of the car ahead. Road rage isn’t just a feeling; it’s a statistically inevitable response to sitting in metal boxes for nearly three months of your life every year.
The US Top Five Congestion Hotspots
LA leads the nation in wasted time. It doesn’t stand alone. The TTI’s top five list is dominated by sprawl and population density:
- San Francisco, California
- Washington, D.C.
- Atlanta, Georgia
- Houston, Texas
California claims five of the top 12 spots overall. Experts agree congestion will worsen as populations swell. Curiously, Boston and New York City are missing from the upper echelons. Maybe their transit systems or geography offer some relief. Maybe they just have worse ways to waste time.
Urban Planning vs. Immediate Relief
Some cities are trying new land-use models. High-density shopping and residential zones designed for bikes and pedestrians. The goal? Get people out of cars.
It’s a good long-term strategy. It won’t fix the gridlock tomorrow. Alleviating congestion requires tough, unpopular decisions. From city councils to individual drivers, adjustments are necessary. These communities need vigilance to see real impact. Short-term fixes won’t cut it.
Global Gridlock: Beyond America’s Borders
American policymakers are watching abroad. Traffic in the US is bad. Elsewhere, it’s catastrophic. The global list for worst traffic includes:
- Bangkok, Thailand
- Beijing, China
- Cairo, Egypt
- Calcutta, India
- Chennai, India
- Jakarta, Indonesia
- Sao Paulo, Brazil
- Shanghai, China
In these cities, commuters weave between larger vehicles on bicycles and motor scooters. India and China have huge populations concentrated in urban centers. Their traffic reputation is well-earned. The sheer volume creates a unique kind of chaos.
“Reducing traffic congestion requires tough and sometimes unpopular decisions from the government level all the way down to the individual driver.”
The problem isn’t just about more lanes. It’s about how we use space. As the situation worsens, officials will look closer at their choices. The question remains whether they’ll act before the roads simply stop moving.